Music Artist Cross Collaboration
In this visualization, we're aiming to show the collaborative nature of the music industry. We're interested in seeing the extent of how much the artists collaborate with each other as well as the trends that we could get out of it.
Our motivation to do this visualization came from our collective personal use of spotify for music streaming and an interest in exploring how often various artists collaborate on albums or songs.
Please note that you can use keyboard keys to navigate this website.
1. Billboard
We wanted to choose artists which most people would know so that it would be easier for people to identity trends. Therefore, as our "original" artists, we choose Billboard's Greatest Artists of All Time.
We used Billboard's API to get the names of the top artists, which we then used Spotify's API to look up the artists and get their canonical Spotify IDs.
2. Spotify
By far the most difficult part of the whole pipeline was gathering the data from Spotify. When we started development on this visualization, we already knew that it would involve a graph structure.
Unfortunately, Spotify's API doesn't allow us to get cross collaborations between artists. Therefore, we had to get all of the track data of an artist and preprocess it to get all of the collaborating artists. Because of this convoluted process; and because number of artists are so huge, we decided to perform a breadth-first graph traversal to ensure that the graph only has relevant artists. The high-level algorithm that we used is as follows:
- Create a list of artists that need to be looked up. Note that in the start case, this list is the Billboard top artists (see the previous slide).
- For every artist, get all of the albums of the artist.
- For every album, get all of the tracks
- For every track, get all of the involved artists
- Compile all of the artists together cross reference that with the already looked up artists to find all of the new artists
- Rinse and repeat with all of the new artists
Note that this is easier said than done. Spotify imposes a lot of restrictions on their API (at least for the free tier), so we had to perform some gymnastics to ensure that we could actually get all of the data. For example, the whole artist-album-track process is to take advantage of batch requesting and reduced the number of requests that we had to make by 20 times. Futhermore, Spotify often rate-limits requests, usually causing the whole program to halt until the request is complete. By heavily utilizing multi-threading, we were able to circumvent this problem and actually generate our entire dataset in less than a minute.
3. Data Preprocessing
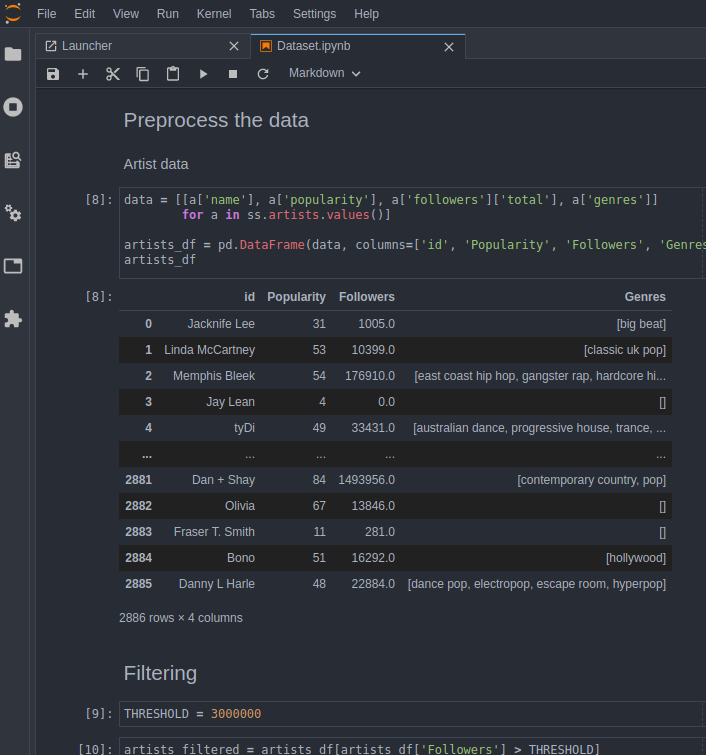
While we were able to get the data from Spotify, there was still a long ways to go before the data was usable.
Data Filtering
One immediate problem was that the size of our data grew incredibly fast. For example, Kanye West (after running our Spotify twice) is connected to 3000 artists and over 30,000 tracks! This is because Spotify's API handles featuring artists in a way that causes a lot of duplicates.
Therefore, we only counted albums of an artist. This firstly eliminates duplicates and helps reduce the phenomenon of some random person creating a remix and tagging the original artist, which really shouldn't be counted as a "collaboration".
Unfortunately this wasn't enough, as the number of artists was still too big. To circumvent this, we filtered out all artists with less than 3,000,000 followers, as this would help keep the size down, as well as increase the chances of people actually recongizing the artist.
Data Aggregation
We stil ended up with a very sizeable dataset, and it doesn't make sense to process the data everytime the viz is loaded. Using Python, we were able to create two data sets. We created a dataset of artists and associated properties (popularity, number of followers, etc). We also reduced our track data into a list of (artist 1, artist 2, # of collaborations together). This new dataset was much leaner than the original one and it made it possible for this viz to run at a reasonable rate.
Genres Naturally Emerge from Collaborations
Our hypothesis that we focused on for this project was that artists would more commonly collaborate with other artists from the same or similar genre. We reasoned that it would be easier for collaborations between two artists of the same or similar genre to happen since it requires less work from either artist than having to adjust to a different style of music.
Our graph confirms this hypothesis as we can see in the GIF. When hovering over nodes to view its collaborations, we see that many artists tend to collaborate within their genre. The links are colored to match the genre of the two collaborating artists.
Exploring the Graph with pan, zoom, and dragging nodes
Filtering Genres by hovering over the genre label colors
Finding the number of collaborations by hovering over links
Comparing Artists by hovering over and clicking on nodes